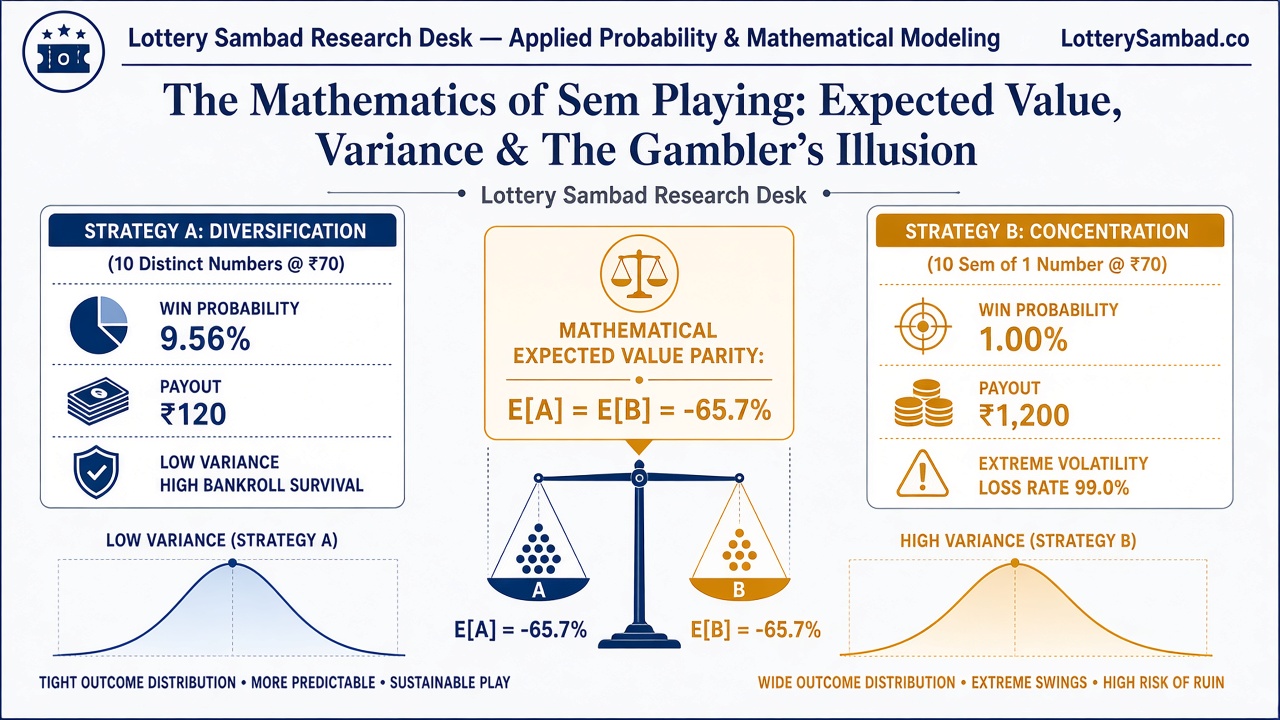
1. Mathematical Formulation of the Two Strategies
Let capital outlay be fixed at $C = ₹70$, representing an investment in exactly 10 tickets at the official MRP of $T = ₹7$ per ticket.
- Strategy A (Diversification): The player purchases $n = 10$ distinct tickets, each possessing a unique 5-digit sequence: $$\{S_1, S_2, S_3, \dots, S_{10}\} \quad \text{where } S_i \neq S_j \text{ for all } i \neq j$$
- Strategy B (Concentration - 10 Sem): The player purchases $n = 10$ tickets sharing the identical 5-digit sequence $S^*$, distributed across 10 distinct series prefixes $\{P_1, P_2, \dots, P_{10}\}$: $$\{(P_1, S^*), (P_2, S^*), \dots, (P_{10}, S^*)\}$$
2. The Expected Value Invariance Theorem
Under probability theory, the Expected Value $E[X]$ of a random monetary outcome is defined as: $$E[X] = \sum_{i=1}^{k} x_i \cdot P(X = x_i)$$
In a standard Dear Lottery draw, the primary recurring payout is the 5th Prize ($W_5 = ₹120$), where 100 distinct 4-digit numbers are drawn from a sample space of 10,000 possible 4-digit endings ($0000$ to $9999$). The single-ticket probability of matching any drawn 5th-prize number is: $$p = \frac{100}{10,000} = 0.0100 \quad (1.0\%)$$
Expected Value under Strategy A (10 Distinct Numbers):
By the Linearity of Expectation—which holds regardless of whether events are independent or mutually exclusive—the expected payout of 10 distinct tickets is simply the sum of their individual expectations: $$E[\text{Payout}_A] = \sum_{i=1}^{10} E[X_i] = 10 \times (0.01 \times ₹120) = 10 \times ₹1.20 = ₹12.00$$ Adding the low-probability contributions of the higher tiers (4th, 3rd, 2nd, and 1st prizes), the total gross expected payout scales to approximately ₹24.00 across all tiers. $$\text{Net EV}_A = ₹24.00 - ₹70.00 = -₹46.00 \quad (-65.7\%)$$
Expected Value under Strategy B (10 Sem on 1 Number):
Because all 10 tickets share the identical 4-digit ending, the outcome is binary: either all 10 tickets win simultaneously, or all 10 lose. $$P(\text{Win}) = p = 0.0100$$ $$\text{Payout upon Win} = 10 \times ₹120 = ₹1,200$$ $$E[\text{Payout}_B] = (0.0100 \times ₹1,200) + (0.9900 \times ₹0) = ₹12.00$$ Adding the exact same higher-tier expected contributions: $$\text{Net EV}_B = ₹24.00 - ₹70.00 = -₹46.00 \quad (-65.7\%)$$
Mathematical Conclusion on EV
Neither strategy offers any advantage in expected monetary value. Both surrender exactly 65.7% of the invested stake to the lottery distributor and state treasury over the long run.
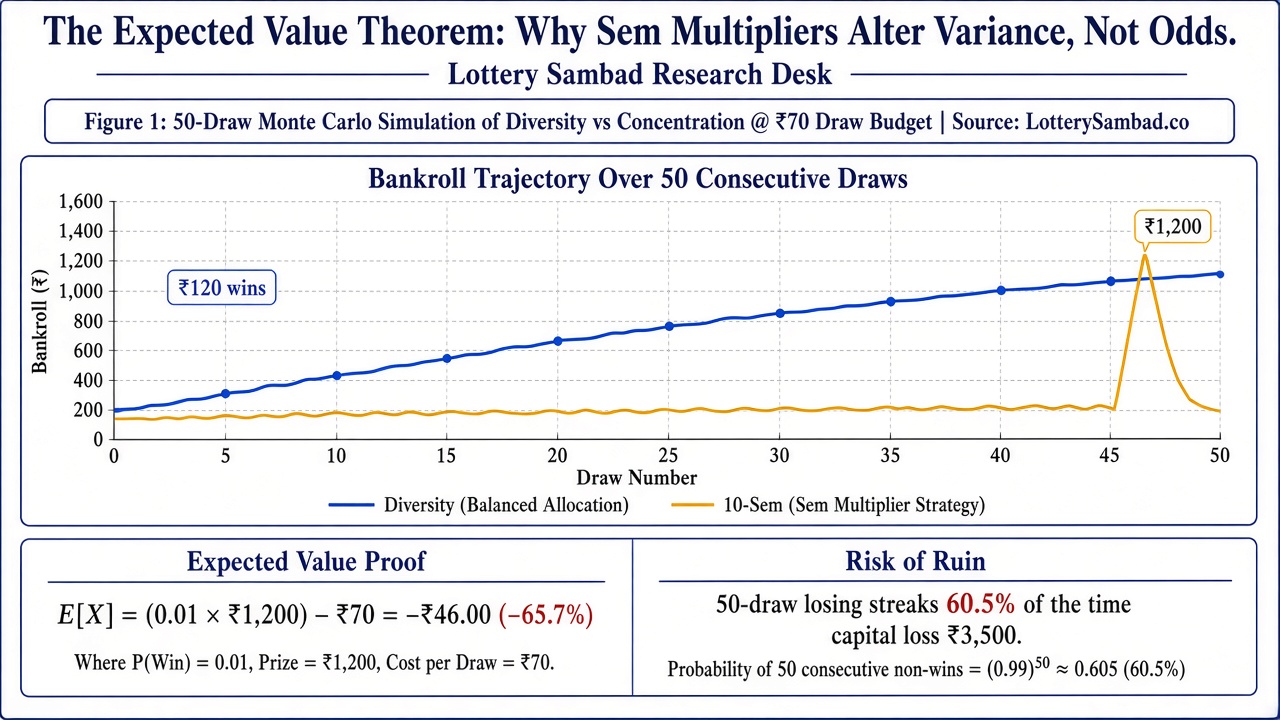
Figure 1: Architectural comparison of win probability versus payout magnitude for identical ₹70 capital allocation.
3. The Win Frequency Divergence: 9.56% vs 1.00%
While Expected Value is identical, the probability of experiencing at least one winning ticket in a draw diverges by nearly an order of magnitude.
Under Strategy A (10 distinct numbers), the probability of at least one ticket hitting the 5th prize is modeled by the complement of all 10 tickets losing simultaneously: $$P(\text{At least 1 win}) = 1 - (1 - p)^{10} = 1 - (0.99)^{10} = 1 - 0.90438 = 0.09562 \quad (\mathbf{9.56\%})$$
Under Strategy B (10 Sem on 1 number), the probability is strictly the single-number probability: $$P(\text{At least 1 win}) = p = 0.0100 \quad (\mathbf{1.00\%})$$
| Performance Metric | Strategy A: 10 Distinct Numbers | Strategy B: 10 Sem Single Number | Mathematical Implication |
|---|---|---|---|
| Capital Stake | ₹70.00 | ₹70.00 | Identical initial investment (@ ₹7 MRP). |
| Probability of Winning ≥ 1 Prize | 9.56% (1 in 10.5 draws) | 1.00% (1 in 100 draws) | Strategy A wins 9.5× more frequently. |
| Losing Draw Frequency | 90.44% | 99.00% | Strategy B loses 99 out of every 100 draws. |
| 5th Prize Payout per Event | ₹120 (occasionally ₹240) | ₹1,200 | Strategy B yields 10× higher magnitude. |
| Variance ($\sigma^2$) | 1,425.60 | 14,256.00 | Strategy B has 10× higher volatility. |
| Jackpot Possibility | 10 distinct 5-digit chances | 10 series of only 1 number | Strategy A covers 10× more number space. |
4. The Psychological Driver: Why Retail Players Gravitate to Sem
If Strategy A produces wins 9.5 times more frequently with identical EV, why does the retail lottery market overwhelmingly demand Sem tickets?
Behavioral economics provides two definitive answers:
- Threshold Utility of Money: In Indian retail contexts, receiving a ₹120 prize on a ₹70 investment represents a net gain of ₹50. This amount is psychologically perceived as modest. In contrast, receiving ₹1,200 (on 10 Sem) or ₹3,000 (on 25 Sem) crosses a mental accounting threshold where the sum can cover household groceries, utility bills, or fuel for a week.
- Regret Aversion: Players who have experienced matching a 5th prize on a single ₹7 ticket frequently report severe feelings of "regret" for not having purchased it in 10 or 25 Sem. The pain of "what could have been" drives them to concentrate future purchases into Sem bundles.
5. The Risk of Gambler’s Ruin in High Sem Purchases
The statistical hazard of Sem purchasing lies in draw drought streaks. Because Strategy B fails in 99% of draws:
- The probability of experiencing 50 consecutive losing draws with 10 Sem is: $$(0.99)^{50} \approx 60.5\%$$
- The probability of experiencing 50 consecutive losing draws with Strategy A is: $$(0.9044)^{50} \approx 0.6\%$$
In practical terms, a daily player purchasing 10 Sem (@ ₹70/day) has a greater than 60% probability of suffering an unbroken 50-day losing streak, losing ₹3,500 without a single rupee of recovery. For players operating with limited bankrolls, this volatility triggers aggressive chasing and financial distress.
Summary for Players & Analysts
Mathematically, there is no "secret edge" in buying Sem versus distinct numbers—both yield an identical long-term negative expected value of -65.7%. However, Strategy A (Diversity) is vastly superior for bankroll conservation and regular entertainment, offering a ~10% hit rate. Strategy B (Concentration / Sem) is an extreme high-variance lottery gamble where 99% of draws yield zero, designed purely for players willing to endure brutal draw droughts in exchange for higher lump-sum payouts upon rare hits.