The ₹54,000 Crore Industry: How Many People Play Dear Lottery Daily? (Economic & Scale Investigation)
1. Reconstructing the Print Run: How Many Tickets Actually Exist?
Under the Lotteries (Regulation) Act, 1998 and the Lotteries (Regulation) Rules, 2010, state governments must pre-determine and officially notify the total number of tickets printed for every scheme.
In a typical Dear Lottery daily draw (e.g., Dear Meghna Morning or Dear Falcon Evening), the ticket matrix is partitioned as follows:
- Coordinate Universe: Every series contains exactly 1,00,000 tickets ($00000$ to $99999$).
- Series Multipliers: Each draw is issued across an authorized batch of series letters ($A, B, C, D, E, G, H, J, K, L$) and numerical sub-batches ($40$ to $99$), resulting in 50 to 100 active series per draw.
- Total Printed per Draw: $50 \times 1,00,000 = 50,00,000$ tickets (minimum) up to $100 \times 1,00,000 = 1,00,00,000$ tickets (maximum during peak festival seasons).
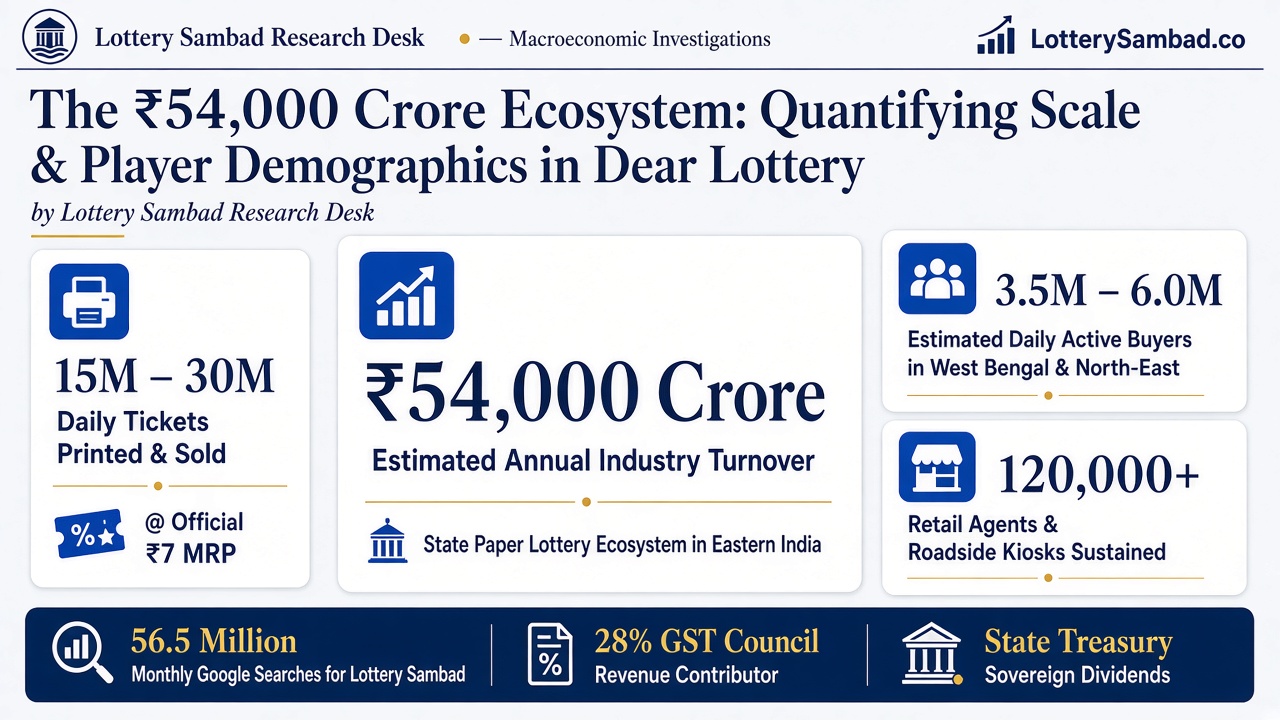
- Daily Total (3 Draws): Across 1 PM, 6 PM, and 8 PM, between 1,50,00,000 and 3,00,00,000 tickets are printed and distributed daily.
| Metric Dimension | Conservative Estimate (Standard Day) | Peak Festival Estimate (Bumper Season) |
|---|---|---|
| Daily Printed Tickets | 1,50,00,000 Tickets | 3,00,00,000 Tickets |
| Face Price per Ticket (MRP) | ₹7.00 | ₹7.00 |
| Daily Gross Retail Turnover | ₹10,50,00,000 (10.5 Crore) | ₹21,00,00,000 (21 Crore) |
| Annualized Direct Turnover | ₹3,832.5 Crore | ₹7,665 Crore |
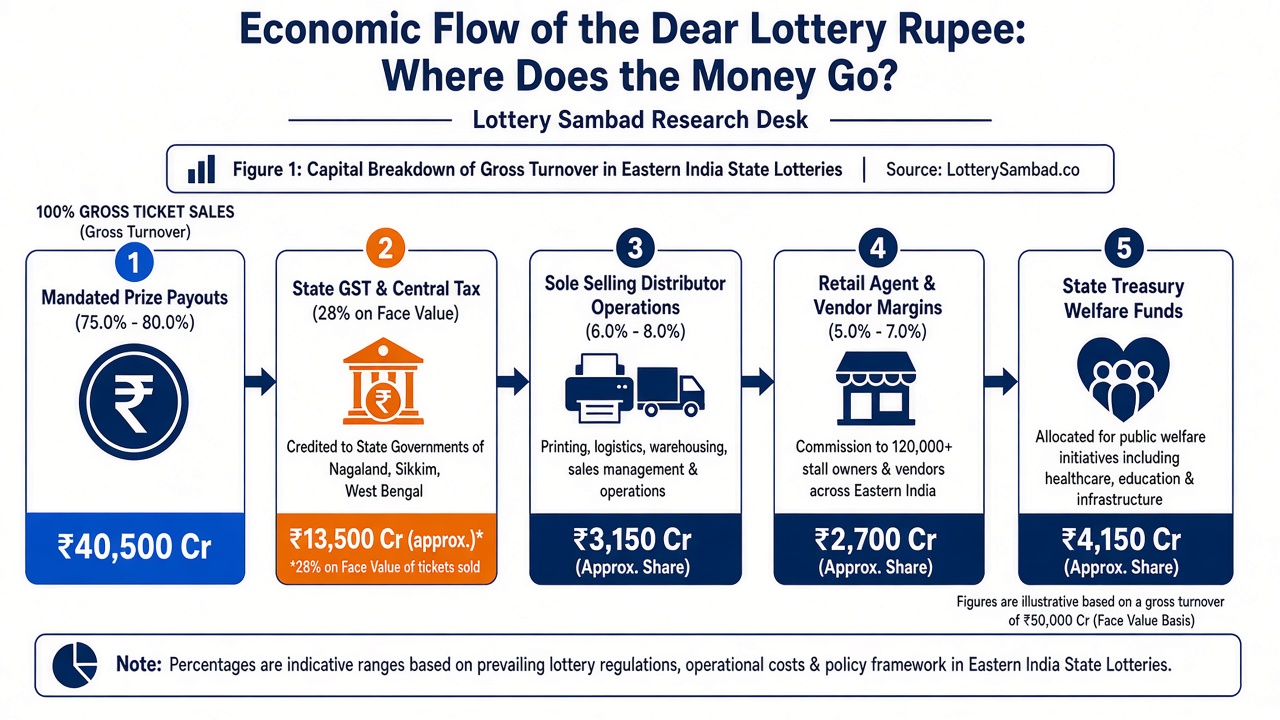
| Mandated Prize Payout (75%–80%) | ₹2,874 Crore returned | ₹6,132 Crore returned |
2. Estimating Daily Unique Players: The "Sem" Multiplier
If 15 to 30 million tickets are circulating daily, how many unique individuals are actually participating?
In retail street reality, lottery buyers rarely purchase a single ₹6 ticket. As detailed in our Guide to 5-Sem, 10-Sem, and Box Playing, the predominant buying behavior across West Bengal and bordering territories is purchasing pre-cut booklets:
The Average Basket Size: 4 to 8 Tickets per Player
The most common transaction at street stalls is a 5-Sem booklet (₹30) or a 10-Sem booklet (₹60). Occasional buyers and wage laborers often split packets or buy single tickets, whereas habitual players may spend ₹100 to ₹300 daily.
Dividing the daily circulation of 1,50,00,000 to 3,00,00,000 tickets by an average basket size of 4 to 6 tickets per participant yields an estimated 35,00,000 to 60,00,000 unique human players every single day.
3. Digital Search Demand: 56.5 Million Monthly Queries
Online traffic telemetry corroborates this massive physical scale. In the digital search ecosystem, queries surrounding state lottery outcomes represent one of the highest-frequency search behaviors on the Indian internet:
- "Lottery Sambad" Brand Search: ~38.2 million monthly searches.
- "Dear Lottery Result / Dhankesari": ~14.1 million monthly searches.
- Draw-Specific Slot Searches (1 PM, 6 PM, 8 PM): ~4.2 million monthly searches.
- Total Digital Search Footprint: Over 56.5 million monthly search events across Google India.
During the synchronized result windows at 1:15 PM, 6:15 PM, and 8:15 PM, server concurrency across official and informational portals spikes to over 2.4 million concurrent users within an 8-minute window.
4. The Macroeconomic Beneficiaries: State Exchequers & Employment
Where does the revenue from this multi-thousand-crore industry flow?
1. Statutory State Draw Fees
Under Central Lotteries Rules, the state governments of Nagaland and Sikkim charge distributors a fixed statutory draw fee of ₹5,00,000 per draw. Across 21 draws weekly per state, each state treasury collects ₹1.05 Crore weekly (over ₹54.6 Crore annually) in non-tax statutory draw revenue alone, utilized for regional healthcare and infrastructural funding.
2. The 28% Unified GST Collection
Following the 38th GST Council meeting, state-run and state-authorized lotteries are taxed at a uniform 28% GST rate on the face value of tickets, channeling hundreds of crores annually into Central and State fiscal pools.
3. 120,000+ Livelihoods in Distribution
The physical distribution model relies on a multi-tiered hierarchy of Main Stockists, Area Sub-Stockists, Counter Stalls, and roadside hawkers. In West Bengal alone, an estimated 120,000 families depend directly on retail commissions (typically ₹0.70 to ₹1.00 per ₹6 ticket sold) as their primary household livelihood.